| Layer Type | Description | Example |
|---|---|---|
| Point | - single location in space | |
Introduction
1. Layers in GIS
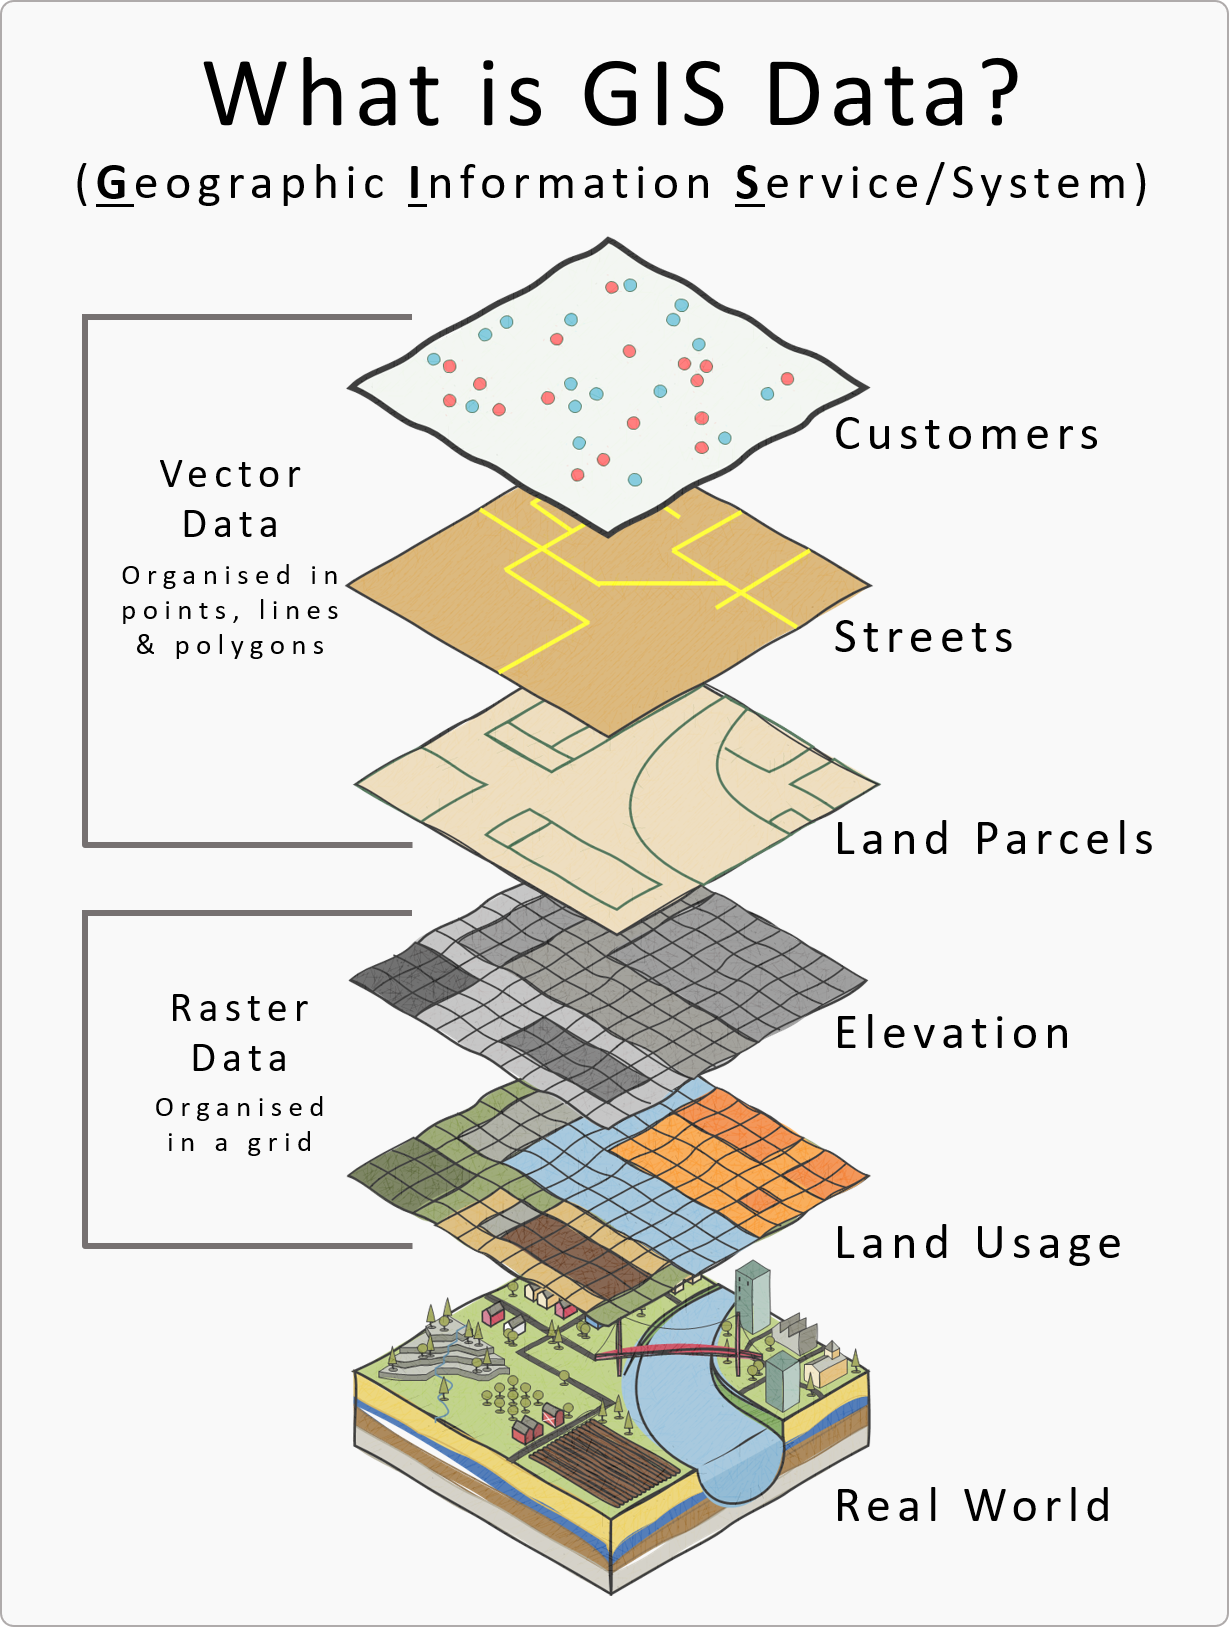
A layer in GIS is a visual representation of geographic data. Think of it as a transparent sheet that contains specific types of information, such as roads, buildings, or rivers. Layers can be stacked on top of each other to create a map. For example:
- A point layer could represent locations like schools or hospitals.
- A line layer could represent roads or rivers.
- A polygon layer could represent areas like parks or buildings.
GeoJSON Layer Types
Example: Point Layer
{
  "type": "Feature",
  "properties": {},
  "geometry": {
    "coordinates": [77.03829503966722, 28.72860558842251],
    "type": "Point"
  }
}
Example: Polygon Layer
{
  "type": "Feature",
  "properties": {},
  "geometry": {
    "coordinates": [
      [
        [77.05173906504365, 28.615648951380365],
        [77.0364072321629, 28.615648951380365],
        [77.0364072321629, 28.595601480628332],
        [77.05173906504365, 28.595601480628332],
        [77.05173906504365, 28.615648951380365]
      ]
    ],
    "type": "Polygon"
  },
  "id": 1
}
2. Feature Layers
A feature layer is a collection of geographic features (points, lines, or polygons) that share the same geometry type and attributes. Each feature in a feature layer has:
- Geometry: The shape (point, line, or polygon).
- Attributes: Descriptive information (e.g., name, population, etc.).
In your example:
- The point feature represents a single location (e.g., a landmark or address).
- The polygon features represent areas (e.g., a park or building).
3. Geometric Feature Layers
A geometric feature layer refers to a feature layer where the geometry (shape) is the primary focus. For example:
- A point layer could represent trees in a park.
- A line layer could represent hiking trails.
- A polygon layer could represent the boundaries of the park.
In your example:
- The point feature is a geometric feature layer with a single point.
- The polygon features are geometric feature layers representing areas.
4. Dimensions in GIS
Dimensions refer to the spatial characteristics of features:
- 0D (Zero-Dimensional): Points (e.g., a location).
- 1D (One-Dimensional): Lines (e.g., roads or rivers).
- 2D (Two-Dimensional): Polygons (e.g., buildings or parks).
- 3D (Three-Dimensional): Volumes (e.g., buildings with height).
In your example:
- The point feature is 0D.
- The polygon features are 2D.
5. Example Breakdown of Your Geolocation Data
Feature 1: Point
{
  "type": "Feature",
  "properties": {},
  "geometry": {
    "coordinates": [77.03829503966722, 28.72860558842251],
    "type": "Point"
  }
}
Type: Point (0D). Coordinates: A single location (latitude: 28.7286, longitude: 77.0383). Example: This could represent a landmark, like a statue or a building.
Feature 2: Polygon
{
  "type": "Feature",
  "properties": {},
  "geometry": {
    "coordinates": [
      [
        [77.05173906504365, 28.615648951380365],
        [77.0364072321629, 28.615648951380365],
        [77.0364072321629, 28.595601480628332],
        [77.05173906504365, 28.595601480628332],
        [77.05173906504365, 28.615648951380365]
      ]
    ],
    "type": "Polygon"
  },
  "id": 1
}
Type: Polygon (2D). Coordinates: A closed shape with five vertices (a rectangle). Example: This could represent a park or a building footprint.
Feature 3: Polygon
{
  "type": "Feature",
  "properties": {},
  "geometry": {
    "coordinates": [
      [
        [77.0485430445732, 28.591178572542205],
        [77.0485430445732, 28.584015637132552],
        [77.05473143947859, 28.584015637132552],
        [77.05473143947859, 28.591178572542205],
        [77.0485430445732, 28.591178572542205]
      ]
    ],
    "type": "Polygon"
  }
}
Type: Polygon (2D). Coordinates: Another closed shape with five vertices. Example: This could represent a smaller area, like a playground or a parking lot.
6. Other Related Concepts
- Attributes: Properties associated with features (e.g., name, population, area). In your example, the properties field is empty, but it could include details like "name": "Central Park".
- Spatial Reference: The coordinate system used (e.g., WGS84 for latitude/longitude).
- Overlay Analysis: Combining layers to analyze relationships (e.g., finding points within a polygon).
- Symbology: How features are styled (e.g., color, size, or shape).
Visualization Example
If you were to visualize your FeatureCollection:
- The point would appear as a single dot on the map.
- The polygons would appear as shaded areas (e.g., rectangles).