exploring-data
Key Points:
- Attribute tables link data values to spatial features in GIS
- Schema defines the structure and data types for attributes (it's just the table itself)
- Records (rows) contain data about individual features
- Fields (columns) contain specific types of information
- Data types include text, integers, and decimal numbers
- Null values are different from empty text values
  {
    "filed1": "row1",
    "field2": "row2"
  }
Examples:
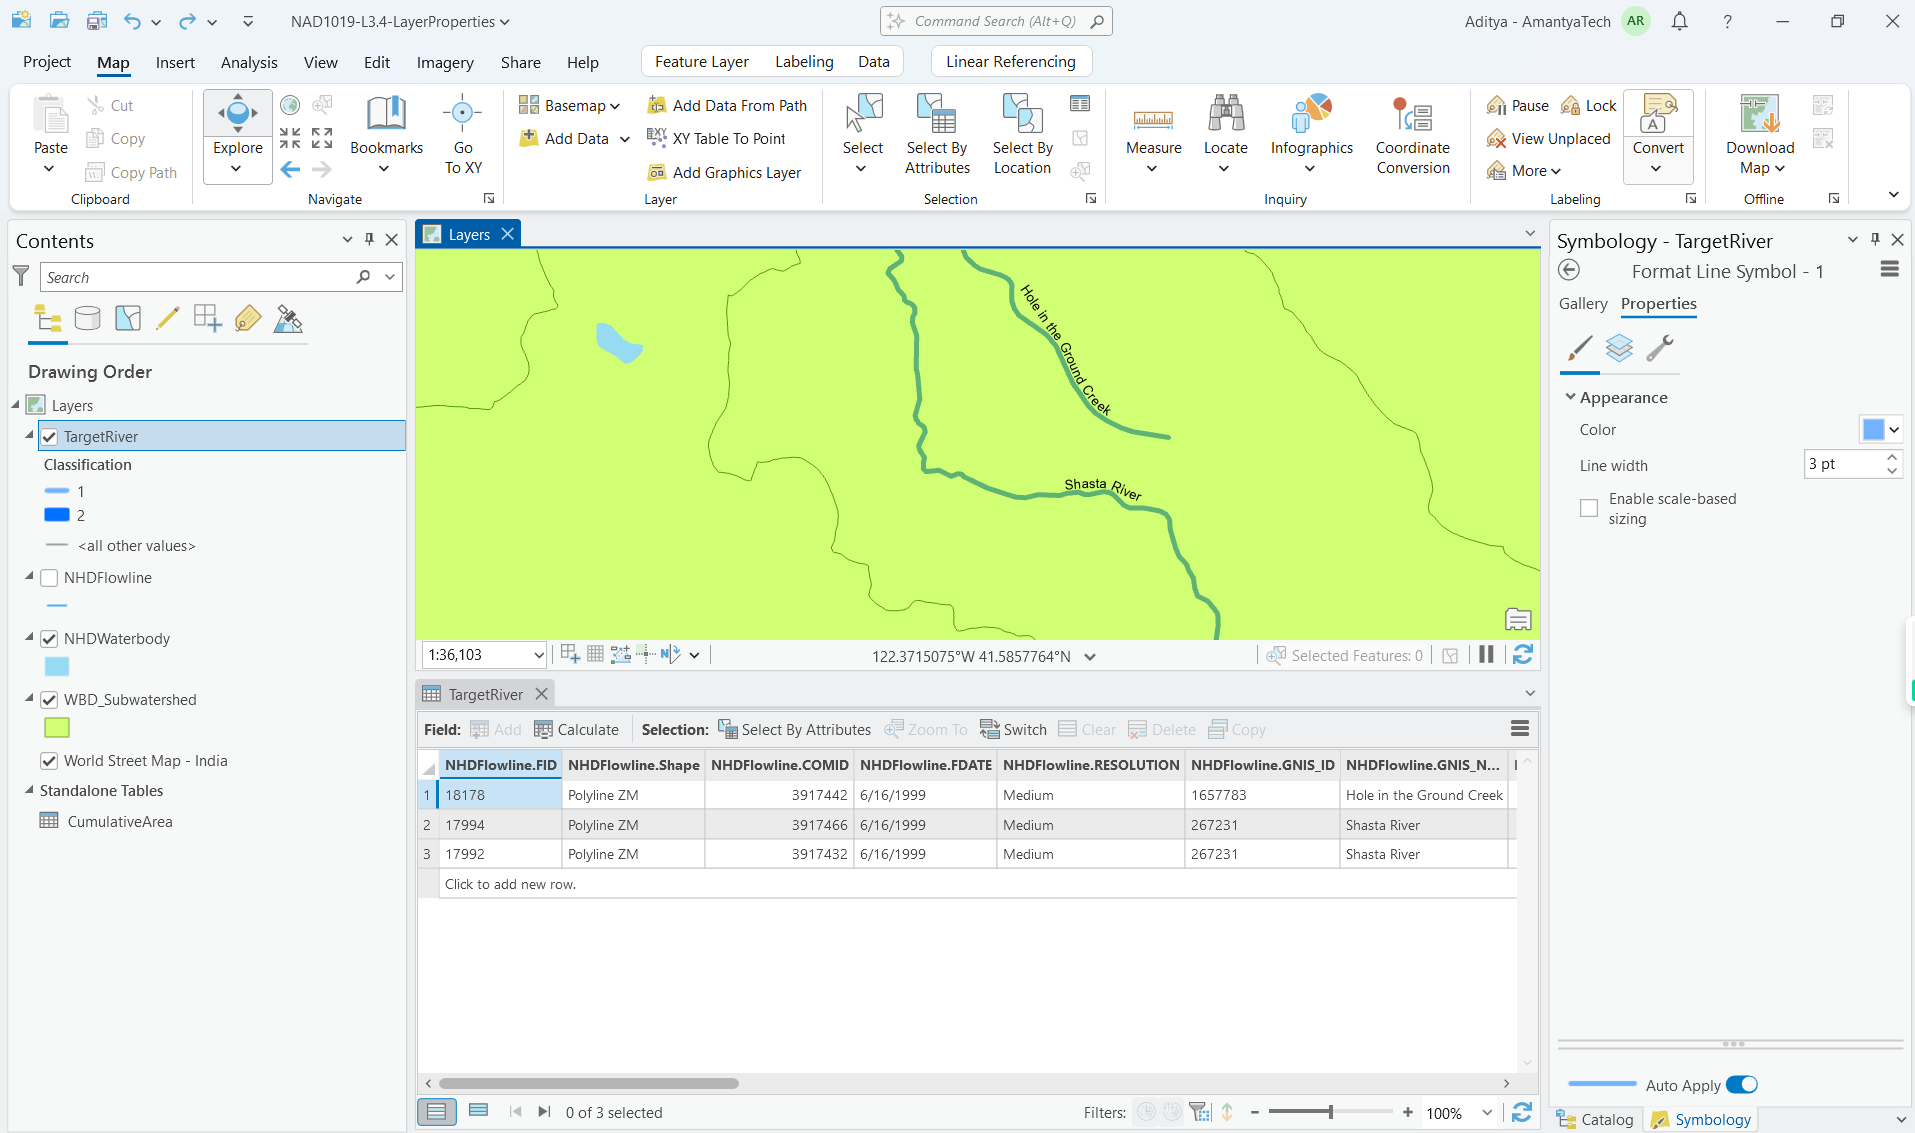
- Rivers data with attributes like:
- Length in kilometers
- GNIS name
- Resolution
- COMID
- Classification (added field)
- Strahler Stream Order Classification:
- Order 1: Headwater streams (no incoming streams)
- Order 2: Where two order 1 streams merge
Key Steps Demonstrated:
- Adding a New Field:
- Click "Add" in attribute table
- Name the field
- Select data type
- Set field length
- Save changes
- Field Calculation:
- Right-click field
- Choose "Calculate Field"
- Use Python 3 expression❗
- Set value (e.g., classification = 1)
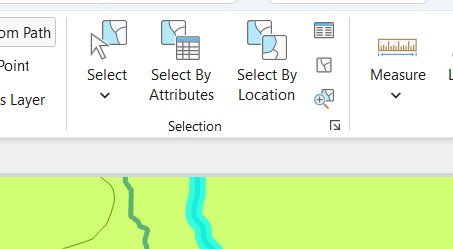
- Interactive Selection:
- Use selection tool
- Click and drag to select features
- Clear selections as needed
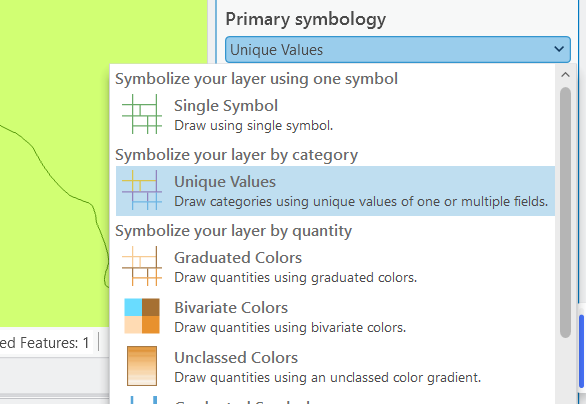
- Symbology Based on Attributes:
- Choose unique values renderer
- Select classification field
- Assign colors and line thickness
- Apply to different values
Common Tasks:
- Picking out specific data from big datasets
- Adding new information to existing features
- Grouping features based on their attributes
- Showing data based on attribute values
- Working with chosen features
Example:
Let's say you have a map of a city with different types of buildings. You can:
- Select only the schools from the map.
- Add information like the number of students to each school.
- Group buildings into categories like residential, commercial, and educational.
- Show only the schools on the map.
- Work with the selected schools to analyze their locations.
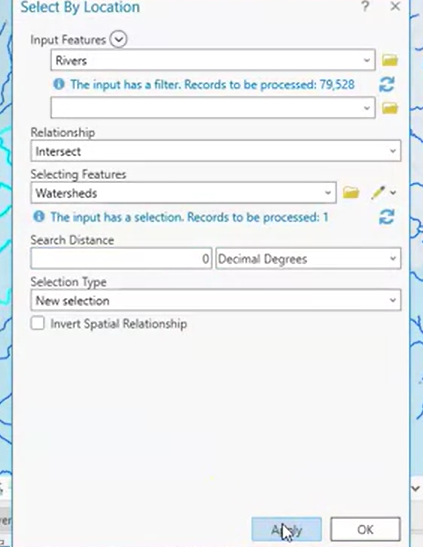
Types of selections:
- Interactive selection.
- select by attributes.
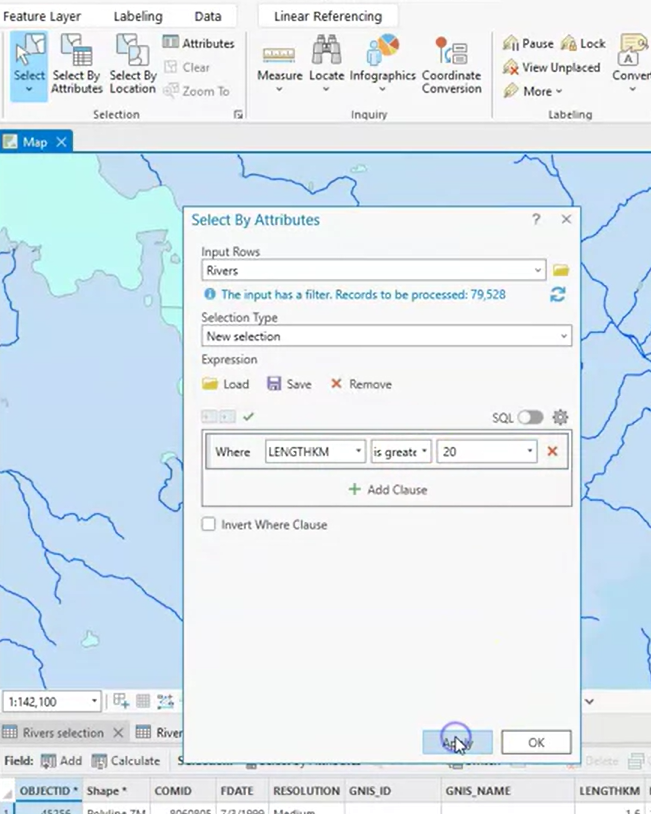
- input features: object that I wanna select
- selecting features: objects that drive the selection
- select by location