Projections and geoprocessing
key terms
- prime maridian: 0° longitude
- equator: 0° latitude
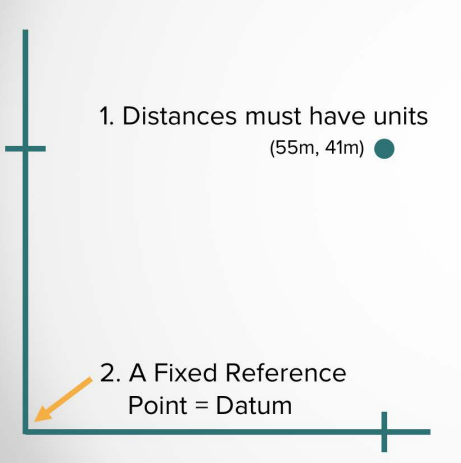
- datum: reference point for measuring locations on Earth
- projection: algorithm to convert 3D Earth to 2D map
All projections have a coordinate system
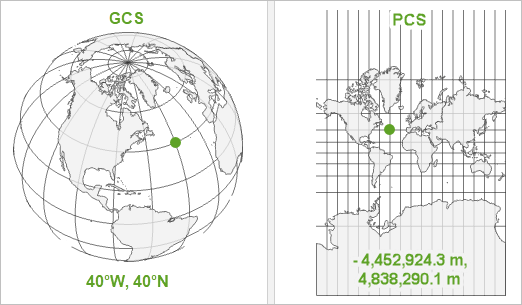
!tl;dr GCS is sphrere, PCS is flat map.
| Geographic Coordinate System | Projected Coordinate System | |
|---|---|---|
| Earth as | sphere 🌍 | flat map 🗺️ |
| Units | datum, angular unit of measure, & central meridian | cartisian coordinates, latitude of origin & central meridian |
| Measured in | angles (44deg ) | meters (22m, 33m) |
!important take earth and squish it inot a flat map -> distortion
Properties that get distorted from 3D to 2D:
- shape
- area
- distance
- direction
Projection types:
- equirectangular (default in ArcGIS): equal, constant distances between parallels and meridians.
- mercator: angles preserved, good navigation, optimized for calculation speed, standard for web mapping
- mollweide: relative areas preserved, shape distorted
- universal transverse mercator (UTM): 60 zones, each 6° wide, good for local mapping
How does Greenland appear in each of these projections?
- equirectangular: meridians converge at poles -> more stretched out at poles -> Greenland looks bigger than it is
- mercator: Greenland looks huge, as big as Africa.
- mollweide: Greenland looks normal, but Africa looks smaller than it is.
Goal
Find all countries that overlap with a bounding box on a map of North and South America.
Steps
- Create a bounding box over target region
- Use Analysis Tools to find overlapping countries
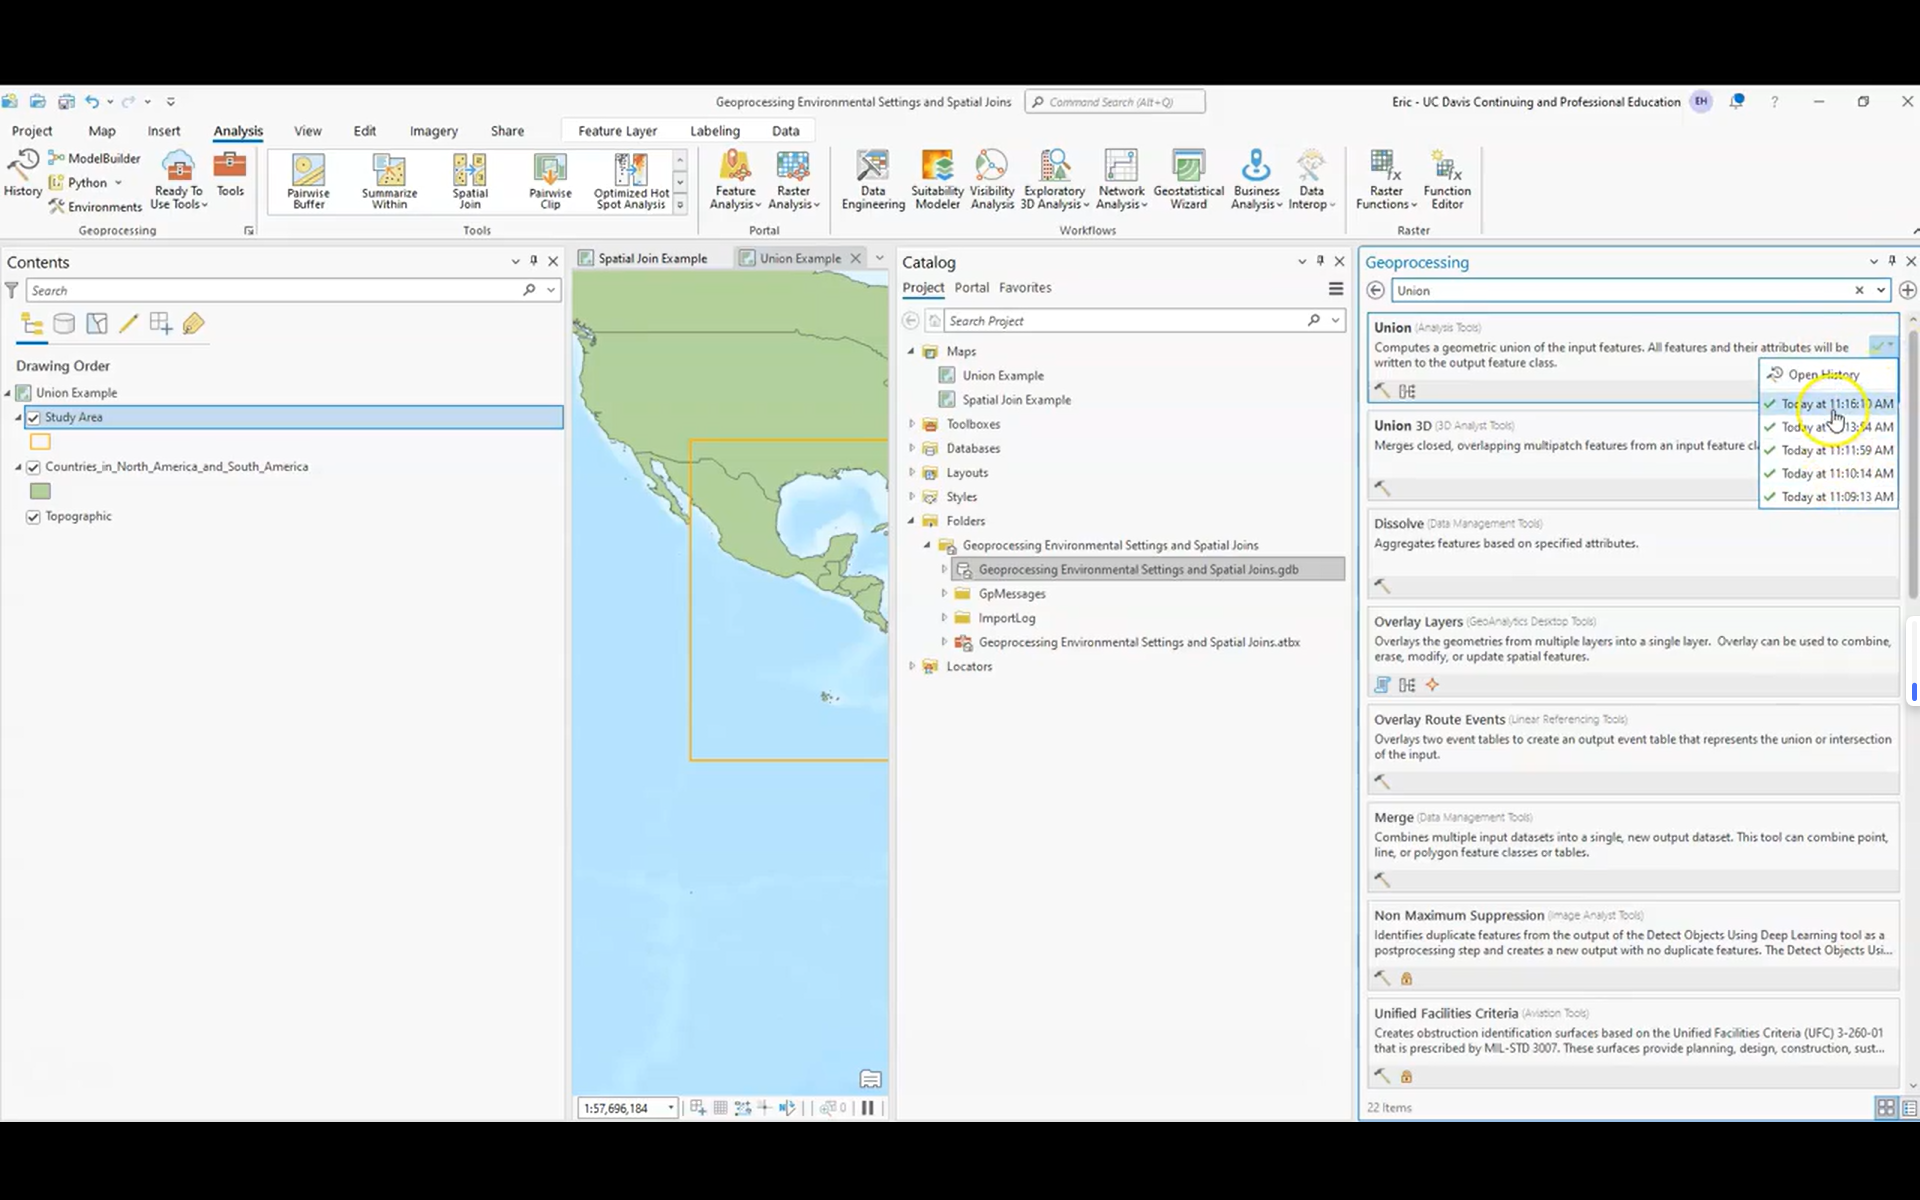
- Run Union tool to combine features
- Join attributes to get country data
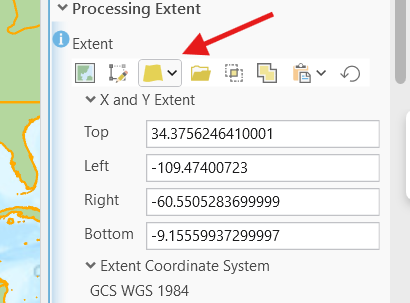
note: need to set environment settings to control tool behavior: mainly the processing extend needs to be set to the extent of layer > the bounding box.
Key points:
- Analysis tab contains geoprocessing tools
- Union tool combines features (like set theory)
- Can join attributes of features
- Environment settings control tool behavior
- Results show all countries intersecting the box
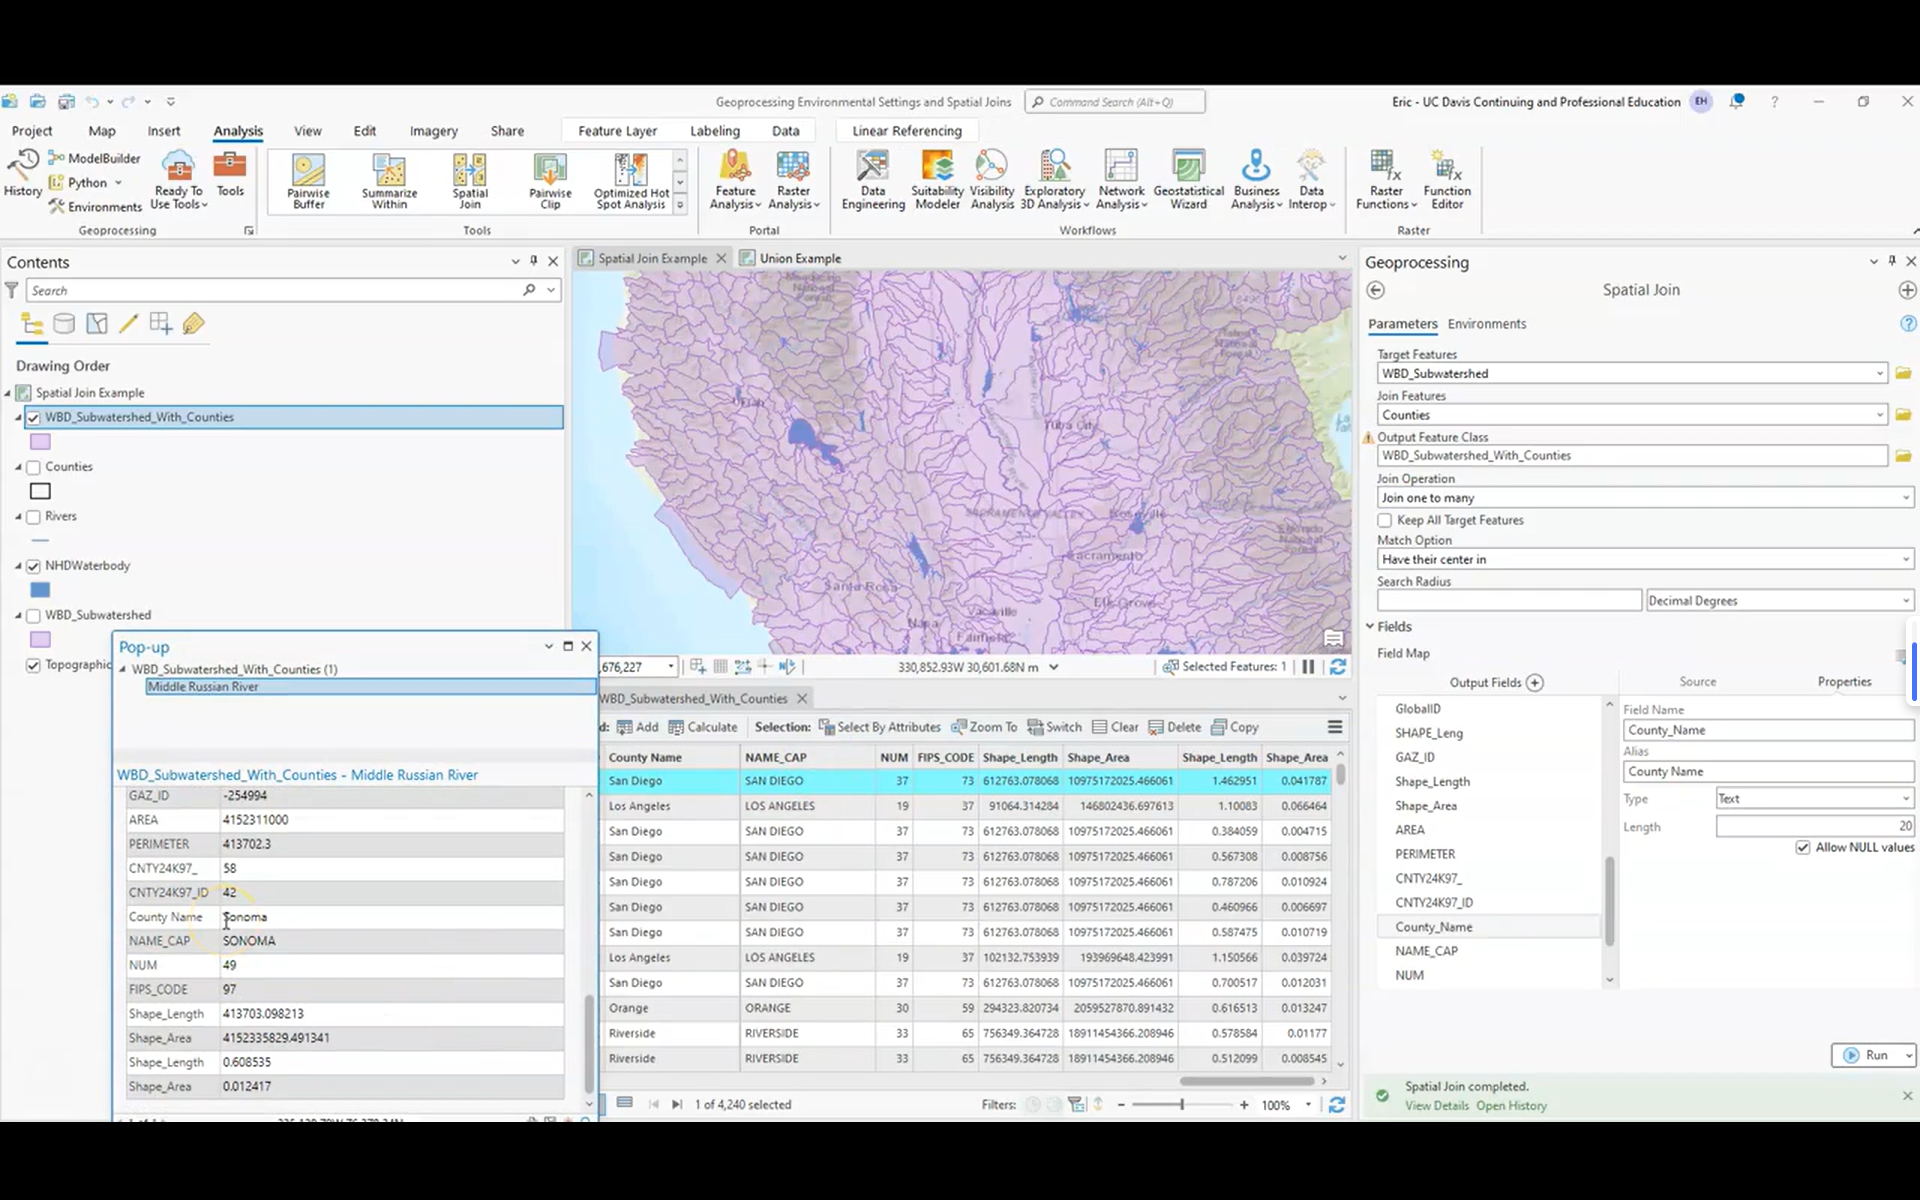
Goal
We've various waterbodies and we want to find out which counties they are in.
Tool: spatial join.
- connects geographic features based on location
Steps
- Select watershed features as target
- Perform spatial join with country boundaries
- Define one-to-many relationship (watershed to countries)
- Configure field mappings and rename attributes
- Review results in attribute table
Key points:
- tool: Spatial Join tool connects geographic features based on location.
- relationship: 1 to many One waterbody can overlap multiple counties.
- Field mapping allows customizing output attributes.
- Attribute table shows final joined data.
- Can rename fields for clarity (e.g., "Name" to "County").
✝️symbology
Concerned with how we choose to display GIS data.
- Water with blue line 🔵
- Counties with red outline 🔴
- Watershed with green fill 🟩
➕ Create a new feature class from selection
- create new map document
- add data - NDHFlowline
- change symbology to style of water 🤽♂️🤽♂️.
- Add navarro_boundary
- Select flowline that intersects location of boundary
- Remove selection of flowline that intersects the ocean.
- Make the only selectable layer.
- Save the new layer (export features).
- Store layer in separate geodatabase to compartmentalize source data and analysis results.
- Clear selected features.